Artificial Neural Networks: Automatic Neuromuscular Diagnostic
Artificial Neural Networks: Automatic Neuromuscular Diagnostic
Article by Neri Accornero · Giovanni Romaniello · Gian Carlo Filligoi · Elio Galiè · Bernardo Gregori
|
=== Artificial Neural Networks:
Automatic Neuromuscular Diagnostics ===
N. Accornero, G. Romaniello*, G.C. Filligoi*, E. Galiè, B. Gregori Department of Neurological Sciences, University of Rome "La Sapienza"
Introduction
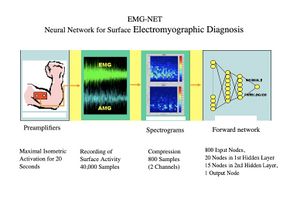
A preliminary study is presented on the automatic diagnosis of neuromuscular disorders using artificial neural networks that evaluate electrical and acoustic surface signals of the muscles under examination. The analysis of the electrical and acoustic (vibratory) activity captured on the muscle surface proves particularly promising for the non-invasiveness of the method, compared to the traditional electromyographic (EMG) exam performed with a disposable needle electrode, for its low cost, and because the recorded activity, coming from a much larger muscle mass than that explored with a needle electrode, theoretically allows for the detection of even subclinical pathologies. Surface recording of muscle activity is also particularly advantageous in sports medicine, in neuromotor rehabilitation, and in the functional control of motorized prostheses. Vibratory signals produced by the contraction and sliding of individual muscle fibers can also be derived from the muscle surface. This activity, called an acousto-myogram (AMG), provides relevant information that correlates with the force exerted and fatigue.[1] Some recent studies have documented the complementarity of the two signals, the electrical and the acoustic, in the evaluation of exercise and muscle fatigue.[2][3][4][5] Surface signals are inherently complex, in the mathematical sense, as they are composed of the sum of the activities of numerous sources (muscle fibers) that are not strictly correlated. Traditional analysis methods, using descriptors such as amplitude, spectrum, and morphology, are difficult to apply. Similarly, the use of expert diagnostic systems, based on rules, has proven to be ineffective. In this context, connectionist systems or artificial neural networks seem particularly suitable, as they achieve remarkable classification capabilities by being trained "by example" rather than by rules.[6] To evaluate this method, we developed a system aimed at performing a screening between normal and pathological conditions in the context of neuromuscular disorders. (Fig. 1)
Considering the particularly encouraging results, a second version of the system was developed, aimed at differentiating within pathological cases between myopathies and neuropathies. This is currently under evaluation in a sample of patients with neuromuscular pathologies in the orofacial region.
Methodology
The surface electrical signal can easily be recorded using electrodes applied to the skin, spaced 3-5 cm apart, and arranged axially along the muscle belly. The amplitude of the electrical signal during muscle activity is highly variable (ranging from less than 1 mV to several tens), and it depends on the level of muscle power exerted, the impedance characteristics of the skin and subcutaneous tissue, fatigue, and other factors.
The spectral content is generally between 50 and 500 Hz and varies depending on the activation modalities and fatigue.
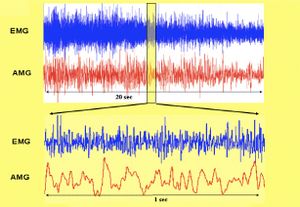
As previously mentioned, contractile activity, physiologically unsynchronized among the multitude of muscle fibers, even within the same motor unit, manifests as a vibration with a frequency range between 5 and 40 Hz, which is much lower than that of the electrical signal (Fig. 2). This vibratory activity can be recorded using a microphone or a piezoelectric membrane applied to the muscle surface. Fatigue also modifies the amplitude and spectral content of the signal in a way that is not necessarily correlated with changes in the electromyographic signal.
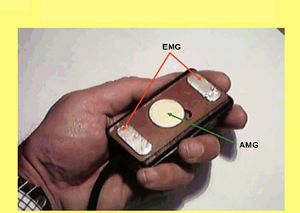
To optimize the recording of these signals, we developed a composite and preamplified electrode, measuring 3x5 cm, that allows for the simultaneous recording of the two signals from the same muscle site (Fig. 3). The preamplifier stage with fixed gain (1000x for the EMG channel, 100x for the AMG channel) is directly mounted near the electrodes, minimizing artifacts from environmental electromagnetic fields, and the differential setup improves the signal-to-noise ratio.
The two amplified signals can be easily acquired by a personal computer equipped with a two-channel analog-to-digital converter.
For this study, recordings were made from six muscles: Biceps, Tibialis Anterior, and Common Finger Flexor bilaterally in all subjects, for a duration of 20 seconds during maximal isometric effort.
To minimize the amount of data to be stored, the digital sampling was reduced to 1 kHz for the EMG channel and 200 Hz for the AMG channel, considering their respective spectral contents.
Subjects
Ten healthy subjects with an average age of 40 ± 12 and 24 pathological subjects (aged 53 ± 15) with various neuromuscular pathologies confirmed by clinical and needle electromyographic data (TAB. 1) were used, for a total of 182 recordings. Of these, 152 randomly selected recordings were used to create the set of example cases for training the neural network, and the remaining 30 were used to form the TEST CASE set.
Artificial Neural Network
The neural network specifically developed has a classic three-layer forward topology; 816 input nodes, 15 in the first hidden layer, 5 in the second, and 1 in the output layer for Normal/Pathological coding. The network was trained using a backpropagation algorithm until an error of 0.03 was reached on the example cases. The 816 input data consist of 400 compressed spectrogram values of each signal (800 data points) plus additional encoded information regarding gender, age, the explored muscle, and the side.
| Example cases | ||||
|---|---|---|---|---|
| Subjects examined | Categories | Num. | Age | Total registrations |
| PHYSIOLOGICAL | 9 | 45 ± 15 | 60 | |
| PATHOLOGICAL | 24 | 53 ± 17 | 122 | |
| NEUROGENIC | 17 | |||
| Amyotrophic lateral sclerosis | 5 | 56 ± 14 | 84 | |
| CIDP | 6 | |||
| Conduction block neuropathy | 1 | |||
| Radiculopathy | 1 | |||
| Diabetic polyneuropathy | 4 | |||
| MYOGENIC | 7 | |||
| Steinert's myotonic dystrophy | 3 | 49 ± 18 | 38 | |
| Corticosteroid-induced myopathy | 3 | |||
| Aspecific myopathy | 1 | |||
Results
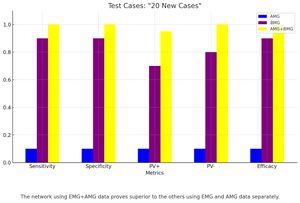
After achieving a good level of training on the example case set (error = 0.03), a test was conducted on the 30 randomly selected test cases. The results were decidedly encouraging, as all new cases were correctly classified. Subsequent tests were carried out using only the electromyographic data and only the acousto-myographic data, with the observation that the network predominantly uses the information contained in the EMG signal (>90%) and that the contribution of the acoustic signal, although consistently low (<10%), complements the diagnostic accuracy. (Fig. 4).
Conclusions
From this preliminary study, the following conclusions can be drawn: - The information contained in surface electrical and acoustic signals is sufficient to diagnose normality or pathology. - The surface electromyographic signal appears indispensable for classification, but the correlation with the acoustic signal improves diagnostic accuracy. - A connectionist system can perform a correct diagnostic classification using a significant compression of the aforementioned signals, consisting of the spectrograms of the two 20-second signals, segmented into 1-second epochs with 20 frequency levels, thus compressing the information from 40,000 samples to 800. - The network's analog output, with values ranging between +1 and -1, allows for a “quantitative” assessment of the diagnosis of normality or pathology.
These results encourage the continuation of the study with the aim of further articulating the diagnostic classification, discriminating between neuropathies and myopathies within the pathological group. To this end, it will be necessary to significantly expand the set of example cases with pathologies from the two mentioned categories, carefully diagnosed clinically and electromyographically.
Bibliography
- ↑ Accornero N., Berardelli A., Manfredi M.: “A composite probe for acoustic and electromyographic recording of muscular activity”. Electroencephalography and clinical Neurophysiology, 72:548-549, 1989.
- ↑ Akataki K., Mita K., Itoh K., Suzuki N., Watakabe M.: “Acoustic and electrical activities during voluntary isometric contraction of biceps brachii muscles in patients with spastic cerebral palsy”. Muscle and Nerve 19:1252-1257, 1996.
- ↑ Barry D.T., Geiringer S.R., Ball R.D.: “Acoustic myography: a noninvasive monitor of motor unit fatigue”. Muscle and Nerve, 8: 189-194, 1985.
- ↑ Dalton P.D., Comerford M.J., Stokes M.J.: “Acoustic myography of the human quadriceps muscle during intermittent fatiguing activity”. Journal of the Neurological Sciences, 109: 56-60, 1992.
- ↑ Esposito F., Malgrati D., Veicsteinas A., Orizio C.: “Time and frequency domain analysis of electromyogram and sound myogram in the elderly”. European Journal of Applied Physiology 73: 503-510, 1996.
- ↑ Hassoun H. M., Wang C., Spitzer A.R.: “NNERVE: Neural Network extraction of repetitive vector for electromyography- Part I-II: Performance analysis”. IEEE Transactions on Biomedical Engineering 41 (11): 1039-1052; 1053-1061, 1994.


