Clinic Electromyography
Clinic Electromyography
Clinical Electromyography
Cesare Iani Head of UOC Neurology, San Eugenio Hospital, Rome
The electromyographic exam (EMG) consists of three sequential phases: 1) spontaneous activity examination, 2) analysis of individual motor units, 3) interference pattern examination during moderate and maximal effort.
Definition of Motor Unit (MU)
The MU is composed of a motor neuron, its axon, and the muscle innervated by the axon. The motor unit activity can be recorded with various types of electrodes: - **Single Fiber Electrode (SF-EMG)**: It records only one or a few fibers of the motor unit. It has a diameter of 25 μm, smaller than a normal muscle fiber, which has a diameter of about 40-50 μm. The recording area of an SF-EMG electrode is comparable to a sphere with a spatial distribution of 300 μm. In a normal subject, this electrode simultaneously records 1 or 2 muscle fibers belonging to the same motor unit.[1] Fig.1

The **Macro-EMG needle electrode** has a very large recording surface: ≅15 mm from a modified EMG electrode cannula. It simultaneously records from the entire motor unit.[2]
The most commonly used electrodes in clinical diagnostics, however, are concentric and monopolar electrodes, which have intermediate characteristics between the two types described above.[3]
The **concentric electrode** has a recording surface of 150 x 580 μm with an area of 0.07 mm², while the **monopolar electrode** is insulated with Teflon except at the terminal portion and has a recording area of 0.5-0.8 mm², thus recording a wider spherical region than the concentric electrode.
In routine recordings, the concentric electrode has significant advantages over the monopolar one, canceling out activity from remote motor units and partially canceling action potentials from distant fibers of the same motor unit. In conclusion, the concentric electrode recording method ensures greater baseline stability.
Generation of the Motor Unit Potential (MUP)
The MUP represents the summed activity of the individual action potentials generated by the muscle fibers belonging to the motor unit. The contribution of each muscle fiber depends on its spatial relationship to the recording electrode. A typical MUP is characterized by a triphasic shape, with an initial positive phase, the main negative peak, and a terminal phase.
.jpg)
The single MUP recorded with a concentric needle represents the activity of 3-15 fibers adjacent to the electrode. The initial phase of the MUP is abrupt and coincides with the initial depolarization of the muscle fiber at the neuromuscular junction. The positive initial phase is generated by the approaching action potential signal, and the duration of the initial positive phase correlates with the distance of the recording electrode from the endplate region.[4] When the electrode is on this region, no positive initial phase forms, and the MUP starts directly in the negative direction from the baseline (isoelectric line). The main negative peak is generated by the summed action potential of the muscle fibers (≅ 15) closest to the electrode. The terminal positive part of the MUP is analogous to the initial one and is generated by the action potentials moving away from the electrode. The small positive wave inserted in the terminal part is generated at the muscle-tendon junction, while the late negative wave that appears after the MUP’s terminal phase is due to an artifact caused by high-pass filters. Satellite potentials are generally produced by a single muscle fiber and are temporally correlated with the main peak. These can be an expression of distal axons with slow conduction in the process of reinnervation, or ectopic endplate potentials, or small-diameter muscle fibers.[5] They may also be present in healthy muscles but in numbers fewer than 1 in 20 MUPs.
MUP Parameters
The following parameters are used in clinical diagnostics: duration, amplitude, size index, spike duration, area, number of phases, number of turns, number of satellites, jiggle.
- Duration**: Includes the main spike, including the initial and terminal parts. The duration reflects the number of muscle fibers in the motor unit and the diameter of the examined fibers.
- Spike duration**: Measured between the first and last positive peak of the MUP. It reflects the temporal dispersion of the potentials of muscle fibers adjacent to the electrode.[4]
- Amplitude**: Measured between the highest positive and negative peaks. It reflects the number of muscle fibers in the motor unit, their diameter, and distribution.[6]
- Spike area**: Calculated by integrating the rectified MUP over the amplitude and spike duration.
- Thickness**: The area divided by the amplitude, which is closely related to the duration but less influenced by baseline variations.
- Number of phases**: The number of crossings of the baseline (isoelectric line). In normal motor units, 2-3 phases are present. MUPs with more than 5 phases are considered polyphasic.
- Number of turns**: The number of positive and negative peaks with an amplitude of no less than 50 µV.
The number of phases and turns reflects the temporal distribution of the action potential volley within the motor unit.
- Size index**: is a new parameter. It represents the thickness normalized for amplitude. It is increased in neurogenic conditions and decreased in myogenic conditions.
- Satellite potentials**: represent reinnervation situations. They are more easily recognized using manual methods, often showing jitter, resulting in reduced amplitude after averaging.[7]
- Variability of MUP, “jiggle”**: In normal muscles, consecutive MUPs obtained from a motor unit are morphologically stable. In the early stages of collateral reinnervation, the jitter and intermittent conduction blocks of single fiber action potentials manifest as instability of the terminal portion of the MUP with variations in the potential shape, known as "jiggle".[8] A method has been developed to measure the jiggle by determining the median of consecutive amplitude differences (CAD) for each MUP point within a predetermined analysis window.
MUP Acquisition
Manual Methods
Traditional methods are based on the recording of one or more MUPs during slight muscle activation. The obtained MUPs were identified, photographed, and measured manually. All MUPs with a rise time of less than 0.5 msec and amplitude greater than 0.5 μV, with repeatable shape and amplitude at least three times, were selected for analysis. With the advent of computerized techniques, an averaging triggered by a spike was achieved. The manual method was modified by introducing a delay line and a level trigger, allowing the selection of one low-threshold MUP at a time and subsequently measuring it manually or using a computerized method.
Computerized Methods
- Template matching**
The computer selects a MUP as a model (template). Subsequent MUPs are compared to the template and classified based on it. When a specific number of MUPs identical to the template are recognized, they are then accepted for analysis. If no MUPs similar to the initial template are recognized, the template is discarded and replaced with a new MUP.
- Signal decomposition EMG**
This method is similar to the previous one. The interference pattern, obtained with mild to moderate contraction, is decomposed into individual MUPs. With this method, it is possible to classify MUPs into separate groups according to shape differences, study firing pattern mechanisms, and analyze MUPs in terms of motor control mechanisms. This method can also be used for MUP analysis.[8]
MultiMUP Analysis
A recently developed analysis system is based on signal decomposition combined with a template that allows the simultaneous analysis of multiple MUPs. The system analyzes the trace in 4.8-second samples. A MUP is identified with a level-trigger criterion and coded rise time characteristics.[8] Once the MUP is identified, the template is created. This can be done for 6 MUPs simultaneously analyzed at that needle placement site. The classified MUPs are subjected to averaging and then displayed on the EMG recording screen with the possibility of observing each sample individually in case of artifact suspicion.[5] With this method, single MUPs can be obtained even from an interference pattern. Each analysis can yield 3 to 6 MUPs.
The advantages of this technique over traditional methods are: 1) very short analysis times, as 20 MUPs needed to complete the exam can be obtained in 2-5 minutes, compared to about 10 minutes using the traditional method to obtain 20 MUPs for each muscle.[5] 2) automatic MUP extraction. 3) simultaneous recognition of MUPs of different amplitudes and shapes at a single recording site. 4) reduced MUP data variability among different examiners. Due to reduced variability and faithful data reproducibility, results between laboratories become directly comparable.
Quantitative MUP Parameter Analysis
Using the multiMUP analysis system, normative data has been collected from normal subjects. The examined muscles are the biceps brachii, deltoid, interosseous, vastus lateralis, and tibialis anterior.[6] The parameters examined include amplitude, duration, area, thickness, size index, number of turns, and number of phases. The amplitude values for the biceps muscle were larger at 436 ± 115 μV compared to those reported by Buchtal (1962) at 175 ± 20 μV. These differences can be interpreted by the different modes of voluntary activation required in the two methods.
In an attempt to identify parameters that make the diagnostic value of EMG analysis significant and emphasize differences, the concept of "outlier" has been applied to MUP analysis, and its statistical significance has been established. For each MUP parameter, significance has been established for the upper and lower limits.[9] The third lowest and third highest value of each parameter from the analysis of 20 consecutive MUPs were considered outliers for that subject, representing the 90th and 10th percentiles. Individual outlier values of each parameter were evaluated using regression analysis to study changes related to age.
Based on this definition, no more than two values above or below the limits were found in normal subjects. To assess the sensitivity of the outlier as a diagnostic tool, the system was applied to patients with neuropathies and myopathies (Figs. 3, 4).
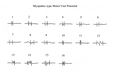
Figure 3: Myopathic-type motor unit potentials (analyzed with the multiMUP method) show reduced amplitude and duration with an increase in the number of turns.
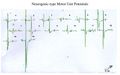
Figure 4: Neurogenic-type motor unit potentials show increased amplitude and duration with an increase in the number of phases.
.jpg)
.jpg)
Interference Pattern (IP) Analysis
The development of muscle contraction is physiologically correlated by two mechanisms: a) recruitment and b) frequency modulation. At minimal voluntary effort, a single motor unit is activated at a frequency of 5-8 Hz. As voluntary force increases, the discharge frequency increases in parallel. When this reaches 8-12 Hz, a new motor unit is recruited at its minimum discharge frequency. As contraction force increases further, both units will further increase their discharge frequency until a third motor unit is recruited, and so on.
The first recruited motor units are small and fatigue-resistant, while those recruited at maximal force are larger, consist of more muscle fibers, and are more prone to fatigue. Some motor units, predominantly type II, are preferentially activated during brief periods of maximal effort. The recruitment order of motor units based on their size is called the "size principle".[9]
When more motor units are activated, the EMG signal becomes so complex that the components of the MUPs can no longer be visually identified. This situation is called an interference pattern. It should be noted that the amplitude of the MUP is primarily determined by the muscle fibers closest to the recording electrode, meaning that MUP amplitude is mainly dependent on the electrode’s position and does not reflect the true anatomical cross-section of the MUP. Larger motor units may have larger fibers, which in turn produce larger MUPs and greater interference pattern amplitude. This is the main reason why the IP signal amplitude increases as contraction force increases.
Large amplitude spikes recorded in the IP during maximal effort contraction may also be the result of summation of two individual MUPs, though this happens in a very low percentage (1-10%) of the largest IP spikes. An important factor contributing to increased amplitude due to summation is the increased density of muscle fibers within the motor unit. This mechanism is particularly influential in cases of reinnervation and is indicative of the sprouting mechanism.
Key Clinical Data
In muscle diseases, IP activity increases more rapidly than the absolute muscle strength compared to a normal muscle. The full interference pattern is achieved with a lower contraction force than in a normal muscle. In many muscle diseases, IP amplitude is reduced, reflecting the smaller cross-section of the muscle components. However, MUP amplitude may increase in some myopathies, reflecting the presence of hypertrophic individual muscle fibers near the recording electrode. In such cases, IP peak amplitude may not differ from normal patterns.
In neuropathic diseases, the number of MUPs activated at a given force level is significantly lower than normal. However, when the sprouting mechanism is activated, MUP amplitude increases, and consequently, the interference pattern is reduced but larger than normal.
IP Analysis Methods
Electromyographers generally interpret IP signals subjectively, observing the signals on an oscilloscope screen or listening to the sounds on audio.[10] To reduce subjective interpretation, different schools have developed various methods for objective analysis of the interference pattern, such as quantitative analysis based on recognizing the sound frequency emitted by MUP and IP activity;[11] frequency-domain analysis, which is based on recognizing the visual analog signal and mathematical processing of the amplitude/frequency ratio of the EMG signal; spectral analysis of frequency, which uses a digital method employing Fourier transform algorithms; time-domain analysis, which, compared to the previously described methods, recognizes the number of peaks per unit of time, expecting a higher number of peaks in myopathic patterns.
A more recent mathematical implementation is Willison's method,[11] which developed an automatic IP analysis system called "turns/amplitude analysis". This method measures the number of turns in the IP signal and the mean amplitude differences between successive turns (MA). A turn occurs at each positive or negative peak, and subsequent turns occur at peaks in the opposite direction. To exclude small amplitude peaks, resulting from background noise, a turn is defined as a signal modification of at least 50 μV between successive turns. In partial chronic denervation situations, the MA increases without changes in the number of turns (NT). This is attributed to the increased density of muscle fibers within the motor unit due to reinnervation.
Fuglsang-Frederiksen[12] measured the NT and MA values and calculated the NT/MA (T/A) ratio and the incidence of short-duration intervals between successive turns. In myopathy patients, they demonstrated that the diagnostic value of T/A analysis is equivalent to MUP analysis. In 80% of the myopathy studies presented, the T/A ratio was characterized by a marked increase in the NT/MA ratio. In neuropathy, this ratio decreases due to a significant reduction in the number of turns attributed to the increased MUP duration. The limitation of this type of analysis is data reproducibility only at comparable muscle contraction levels, so the examination is limited by the need to monitor force.
- Clouds Analysis**
Stolberg and collaborators developed a computerized T/A analysis system that does not require monitoring contraction force. IP signals are recorded from 6-10 sites in the examined muscle at 3-5 force levels ranging from minimum to maximum for each site. NT and MA values are measured from each of the 20-40 epochs, and a plot of the MA/NT ratio is created for each epoch. An area of this plot called the “Normal Cloud” is defined as the part that contains more than 90% of the points from a reference population. A discrepancy greater than 10% of the analyzed points that fall outside the normal cloud is considered abnormal. Myopathy patients have more points in the lower part of the “normal cloud,” while in neuropathy, the points are located in the upper side of the normal value or outside the normal curve (Fig. 5, 6, 7).
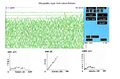
Figure 5: Interference pattern EMG trace in a patient with myopathy. Early low-amplitude recruitment is observed. The lower panel shows the plot of the Cloud method (see text).
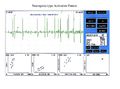
Figure 6: Neurogenic-type EMG trace. Single oscillation motor units of large amplitude and increased duration are observed. The full interference pattern is not achieved with maximal voluntary contraction.
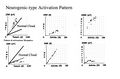
Figure 7: This series of graphs represents the Cloud plots in neurogenic (upper) and myopathic (lower) pathologies. In the first panel, it is observed that in the neurogenic pattern, the plot points fall above the normal cloud, while in the myogenic pattern, they fall below.
.jpg)
.jpg)
.jpg)
Bibliography
- ↑ Sonoo M., Stalberg E.: The ability of MUP parameters to discriminate between normal and neurogenic MUPs in concentric EMG: analysis of the MUP thickness and the proposal for a "size index". Electroencph. Clin. Neurophys. 3:291-303, 1993.
- ↑ Buchthal F., Pinelli P. et al.: Action potentials parameters in normal human muscle and their physiological determinants. Acta Physiol Scand 22:210-229, 1954.
- ↑ Stalberg E., Antoni L.: Computer aided EMG analysis. In (Desmedt ed.) Progress in clinical neurophysiology. Karger, Basel vol.10 186-234, 1983.
- ↑ 4.0 4.1 Stalberg E., Bishoff C.: Outliers, a way to detect abnormality in quantitative EMG. Muscle and Nerve 1982; 5: 265-80.
- ↑ 5.0 5.1 5.2 Stalberg E., Bishoff C.: Reference values of motor unit potentials recorded with multi-MUP EMG. Muscle and Nerve 1994; 17: 842-851.
- ↑ 6.0 6.1 Sacco G., Buchtal F.: Motor unit potentials at different ages. Arch Neurol 6:366-373, 1962.
- ↑ Mc Gill K.C., Cummins K.L. et al.: Automatic decomposition of the Clinical Electromyography. IEE Trans Biomed Engin 32:470-77, 1985.
- ↑ 8.0 8.1 8.2 Mc Gill KC, Dorfman LJ: Automatic EMG decomposition in brachial biceps. Electroencephalogr Clin Neurophysiol 61:561-67,1988.
- ↑ 9.0 9.1 Henneman E., Clamann HT, Gillus JD, Skinner RD.: Rank order of motor neurons within a pool: law of commination. J. Neurophysiol 1974; 37: 1338-49.
- ↑ Walton JN.: The electromyogram in myopathy: analysis with the audio-frequency spectrometer. J. Neurol Neurosurg Psychiatry. 1952; 15: 219-26.
- ↑ 11.0 11.1 Willison RG. Analysis of electrical activity in healthy and dystrophic muscle in man. J. Neurol Neurosurg Psychiatry. 1964; 27: 386-94.
- ↑ Fulgsang-Frederiksen A et al.: Diagnostic yield of the analysis of the pattern of electrical activity and of individual motor unit potentials in myopathy. J. Neurol Neurosurg Psychiatry. 1976; 39:742-50.