In pratica
Queste due equazioni sono il modo in cui creiamo i nostri analoghi quasi quantistici. La seconda equazione è un'estensione del teorema di Ehrenfest, che mette in relazione il momento medio di una particella con la derivata temporale della sua posizione media. Dove abbiamo assunto una Hamiltoniana con solo un potenziale spazialmente dipendente.
Si noti che poiché le posizioni sono fisse nello spazio (posizioni degli elettrodi) solo la probabilità cambia nel tempo. In tutto questo articolo la massa è stata considerata come unità per entrambi i momenti e . Ciascuno dei 92 elettrodi è stato proiettato sul piano orizzontale, quindi il th elettrodo è stato descritto da un unico punto .
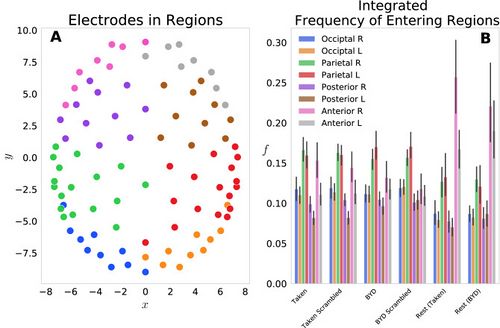
Abbiamo prima esaminato questo modello raggruppando i 92 elettrodi in otto regioni del cuoio capelluto: anteriore L/R, posteriore L/R, parietale L/R, occipitale L/R e le probabilità di ciascun elettrodo nella regione sono state sommate per dare un probabilità a livello di regione. La Figura 1A mostra le posizioni di ciascun elettrodo , con colori diversi che rappresentano ciascuno degli otto gruppi. La figura 1B mostra la frequenza di ingresso in ciascuna regione, raggruppata per le quattro condizioni di attività e due condizioni di riposo.
Ciò riflette il conteggio normalizzato delle probabilità regionali integrate nel tempo.
Abbiamo scoperto che ciascuna regione anteriore veniva inserita più frequentemente a riposo rispetto a quando i soggetti erano impegnati in entrambi i film. In particolare, le regioni anteriori sinistra e destra avevano un cambiamento di stimolo significativo, con (Tukey aggiustato) per preso a Riposo preso—Preso, Riposo preso—Riposo BYD—Riposo BYD e Riposo BYD—Riposo BYD. Ciò è in linea con le scoperte di Axelrod e colleghi che hanno mostrato che l'attivazione nella regione frontale era associata al vagabondaggio della mente.[1][2] Abbiamo riscontrato una soppressione della frequenza nelle regioni posteriori e un aumento della frequenza anteriore a riposo rispetto alle condizioni stimolate, coerentemente con studi fMRI che mostrano una maggiore attivazione nella corteccia cingolata posteriore e nella corteccia prefrontale mediale durante il riposo.[3][2][4][5][6][7] Pertanto, suggerendo che il nostro modello catturi la tendenza frontale associata all'attività cerebrale a riposo.

Phase space
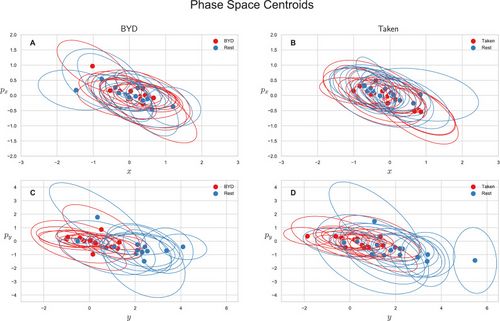
We also explored the average-valued phase space of this system. The phase space for each subject was plotted as the average position and momentum along the direction or as the average position and momentum along the direction . Figure 2 shows the centroids of the phase space scatter plots for each subject with an ellipse representing the one standard deviation confidence interval. Note that values are only reported for the intact stimuli as an analysis of variance shows the scrambled and intact movies are indistinguishable in phase space (P, Tukey adjusted). Figure 2A and B show the projection of the phase space centroid onto the plane spanned by and for “Bang! You’re Dead” and “Taken” respectively, and Fig. 2C and D () plane. The average position along the axis for the intact stimulus (“BYD” and “Taken”) and their scrambled forms are significantly different from the pre-stimulus rest counterparts with (Tukey adjusted) whereas the task-positive and resting centroids are indistinguishable in the plane (, Tukey adjusted). The averages of the group are reported in Table Table11 along with their standard deviations. These values are the averaged value of the centroids (average of the within stimuli centre points in Fig. 2) for the respective position/momenta within each stimulus level. As also seen in Fig. 2C and D, there is a striking difference of one order of magnitude for between the resting and task conditions, yet no marked differences in , , or .

- ↑ Cite error: Invalid
<ref>tag; no text was provided for refs named:8 - ↑ 2.0 2.1 Cite error: Invalid
<ref>tag; no text was provided for refs named:3 - ↑ Cite error: Invalid
<ref>tag; no text was provided for refs named:2 - ↑ Wang RWY, Chang WL, Chuang SW, Liu IN. Posterior cingulate cortex can be a regulatory modulator of the default mode network in task-negative state. Sci. Rep. 2019;9:1–12. [PMC free article][PubMed] [Google Scholar]
- ↑ Uddin LQ, Kelly AMC, Biswal BB, Castellanos FX, Milham MP. Functional connectivity of default mode network components: Correlation, anticorrelation, and causality. Hum. Brain Mapp. 2009;30:625–637. doi: 10.1002/hbm.20531. [PMC free article][PubMed] [CrossRef] [Google Scholar]
- ↑ Stawarczyk D, Majerus S, Maquet P, D’Argembeau A. Neural correlates of ongoing conscious experience: Both task-unrelatedness and stimulus-independence are related to default network activity. PLoS One. 2011;6:e16997. doi: 10.1371/journal.pone.0016997.[PMC free article] [PubMed] [CrossRef] [Google Scholar]
- ↑ Greicius, M. D., Krasnow, B., Reiss, A. L., Menon, V. & Raichle, M. E. Functional Connectivity in the Resting Brain: A Network Analysis of the Default Mode Hypothesis. www.pnas.org. [PMC free article] [PubMed]


