|
|
| Line 79: |
Line 79: |
| Considering the minimum value these products reach for each subject, we see a constant value in both x and y of <math>0,78\pm0,41\tfrac{cm^2}{4ms}</math>, an average value of the <math>9,3\pm4,4\tfrac{cm^2}{4ms}</math>, and a constant standard deviation of <math>18\pm29\tfrac{cm^2}{4ms}</math>. The unit of <math>\tfrac{cm^2}{4ms}</math> arises from the sampling of 250 Hz. Maximum values differ across stimulation. Values are reported as mean across subjects plus or minus 1 standard deviation. | | Considering the minimum value these products reach for each subject, we see a constant value in both x and y of <math>0,78\pm0,41\tfrac{cm^2}{4ms}</math>, an average value of the <math>9,3\pm4,4\tfrac{cm^2}{4ms}</math>, and a constant standard deviation of <math>18\pm29\tfrac{cm^2}{4ms}</math>. The unit of <math>\tfrac{cm^2}{4ms}</math> arises from the sampling of 250 Hz. Maximum values differ across stimulation. Values are reported as mean across subjects plus or minus 1 standard deviation. |
|
| |
|
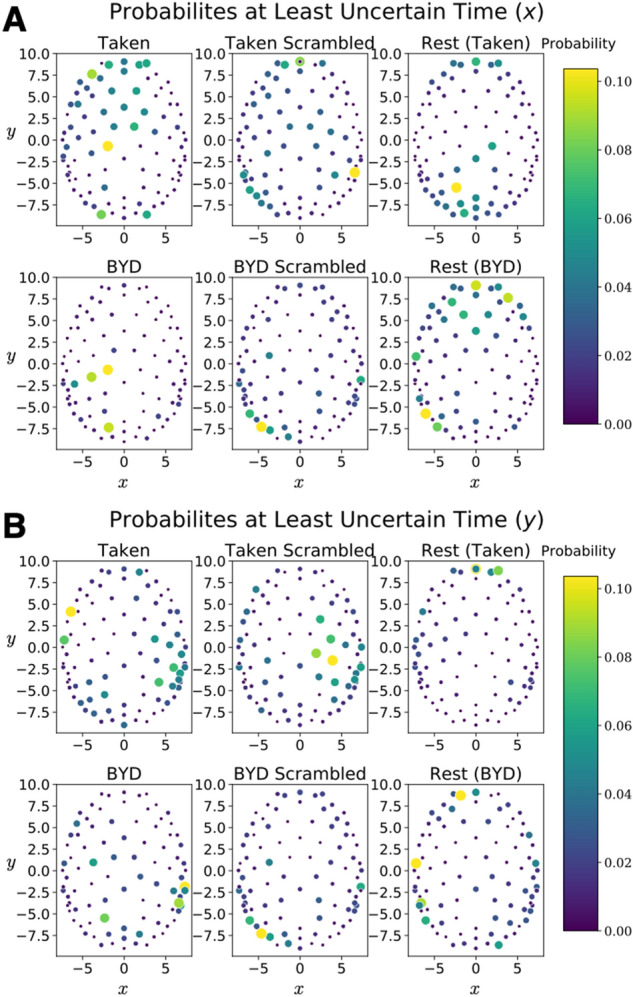
| [[File:Figure 3.jpeg|center|thumb|788px|<small>'''Figura 3:''' Probability maps corresponding to the least uncertain time point for each of the six experimental conditions. ('''A''') The probabilities which lead to the minimum uncertainty as defined by the minimum of . ('''B''') The probabilities which lead to the minimum uncertainty as defined by the minimum of . One subject is displayed for all Taken stimuli, and another for all Bang! You’re Dead stimuli.</small>]] | | [[File:Figure 3.jpeg|center|thumb|788px|<small>'''Figura 3:''' Probability maps corresponding to the least uncertain time point for each of the six experimental conditions. ('''A''') The probabilities which lead to the minimum uncertainty as defined by the minimum of<math>\Delta x(t)\Delta p_x(t)</math>. ('''B''') The probabilities which lead to the minimum uncertainty as defined by the minimum of <math>\Delta y(t)\Delta p_y(t)</math>. One subject is displayed for all Taken stimuli and another for all Bang! You’re Dead stimuli.</small>]] |
Latest revision as of 09:56, 30 March 2023
Table 2
Various values extracted from the time courses of the products
 and
and  .
.
| Stimulus
|

|

|

|

|

|

|

|

|
| Taken
|

|

|

|

|

|

|

|

|
| Taken Scrambled
|

|

|

|

|

|

|

|

|
| Bang! You’re Dead
|

|

|

|

|

|

|

|

|
| Bang! You’re Dead Scrambled
|

|

|

|

|

|

|

|

|
| Rest (Pre-Taken)
|

|

|

|

|

|

|

|

|
| Rest (Pre-BYD)
|

|

|

|

|

|

|

|

|
Considering the minimum value these products reach for each subject, we see a constant value in both x and y of  , an average value of the
  , and a constant standard deviation of
  . The unit of
  arises from the sampling of 250 Hz. Maximum values differ across stimulation. Values are reported as mean across subjects plus or minus 1 standard deviation.

Figura 3: Probability maps corresponding to the least uncertain time point for each of the six experimental conditions. (A) The probabilities which lead to the minimum uncertainty as defined by the minimum of . (B) The probabilities which lead to the minimum uncertainty as defined by the minimum of
  . One subject is displayed for all Taken stimuli and another for all Bang! You’re Dead stimuli.


